Table of Contents
Motion- Distance and Displacement
Distance
- What It Is– Imagine you walk around your school playground, following the path. The distance is the total length of that path you walked.
- How to Calculate- If you know how fast you were walking (speed) and how long you walked (time), you can figure out the distance. It’s just speed multiplied by time.
- Units- We measure distance in metres or kilometres. It’s like using a ruler or a measuring tape but for much longer paths.
Displacement
- What It Is- Now, think about a straight line from where you started walking to where you ended. That’s displacement. It’s the shortest way to get from the start to the end.
- Difference from Distance- Displacement might be shorter than the distance. If you walk in a circle and end up where you started, your displacement is zero (because you’re back at the start), but your distance is the entire circle you walked.
What is Motion
Object in Motion
- What It Means- If something changes where it is over time, it’s moving.
- Example- A car driving on a road is a great example. It’s in a different place every moment – that’s motion.
Object at Rest
- What It Means- If something stays in the same place, it’s at rest.
- Example- If you stand in one spot on the playground and don’t move, you’re at rest.
Basics of Standard Units
Units and Standardization
- Distance- We use metres (m) to measure how far something is or has moved. It’s a standard unit, like using the same ruler everywhere.
- Time- Time is measured in seconds (s). Just like when you count, “1 second, 2 seconds…”.
- Speed- This tells how fast something is moving. We measure it in metres per second (m/s). It’s like saying, “This car moves 10 metres every second.”
Rapid Revision – Class 7 Science- Chapter 13 – Motion and Time
Types of Motion
1. Rectilinear/Translatory Motion
- What It Is-
- This is when something moves in a straight line and doesn’t turn or curve.
- Think of it like drawing a straight line with a pencil without lifting it off the paper.
- Example-
- A car driving on a straight road is a perfect example. It keeps going forward without turning left or right.
2. Circular Motion
- What It Is-
- This is when something moves in a circle. It keeps going around a fixed centre point, like a wheel turning.
- The distance from the centre point to the moving object stays the same, making a perfect circle.
- Example-
- Planets orbiting around the sun are in circular motion. They travel in a circular path around the sun, which is at the centre.
3. Periodic/Oscillatory Motion
- What It Is-
- This kind of motion happens when something moves back and forth in a regular pattern. It repeats the same movement over and over again after equal time intervals.
- It’s like swinging on a swing- you go forward and then back to the same spot.
- Example-
- The swinging of a simple pendulum is a classic example. When you lift a pendulum to one side and let go, it swings to the other side and then comes back, repeating this movement.
Also Check – Non-Uniform and Uniform Motion – for Upper Primary School Students
Concept of Speed-
Speed Definition
Speed is a measure of how fast an object is moving. It is calculated by dividing the distance covered by the time taken to cover that distance. The formula for speed is-
- Speed= Total time taken / Total distance covered
- The concept is that if one vehicle covers a greater distance in the same amount of time as another, it is moving faster.
Units of Speed-
- The basic unit of speed is metres per second (m/s), but it can be expressed in kilometres per hour (km/h) or metres per minute (m/min) depending on the context.
- All units are written in singular form, such as 50 km/h and not 50 kms/h.
Average Speed-
- When we consider vehicles moving over a period of time, they may not move at a constant speed throughout. They may start slow and then pick up speed. Thus, we often refer to the average speed, which considers the total distance covered in the total time taken, regardless of speed variations during that period.
Slow vs. Fast Motion-
- The notion of slow or fast motion is relative and can be understood by comparing the distances different objects move in the same interval of time. For example, in a 100-metre race, the athlete who covers the distance in the shortest time is the fastest.
Measuring Speed-
The process of measuring speed is integral to understanding motion. Speed provides us with a quantitative measure of how fast an object is moving. There are two primary instruments used for measuring aspects related to speed-
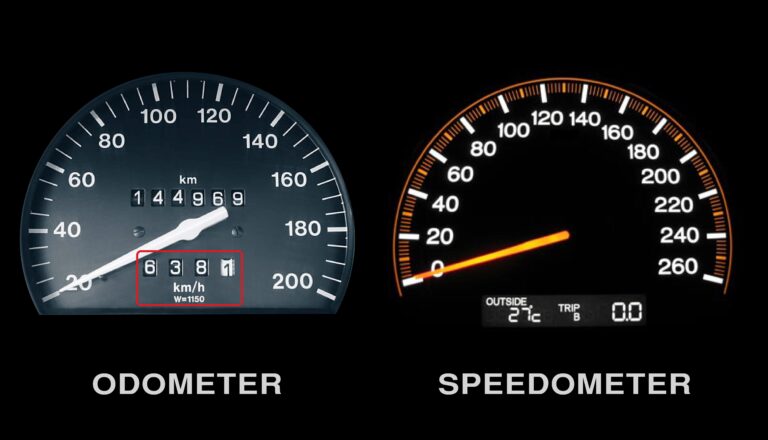
Odometer-
- An odometer is an instrument used to measure the distance travelled by a vehicle.
- It records the total distance covered from the start to the end of a journey.
- This measurement is crucial because, to calculate the speed, one of the essential factors we need is the total distance covered.
Speedometer-
- A speedometer, on the other hand, indicates the instantaneous speed of a vehicle.
- It shows the speed at which the vehicle is moving at a particular moment, which can vary from one moment to the next.
- Unlike the odometer, the speedometer reading changes continuously as the vehicle accelerates or decelerates.
Calculations-
- To calculate speed, we use the formula- Speed = Total distance covered / Total time taken.
- For instance, if a car travels 100 km in 2 hours, its speed is calculated as 50 km/h.
- It’s important to note that this calculation gives the average speed over the course of the trip, as the car may have been travelling at different speeds during different parts of the journey.
Fastest Speed That Some Animals Can Attain
| S. No. | Name of the object | Speed in km/h | Speed in m/s (approx.) |
| 1. | Falcon | 320 | 88.89 |
| 2. | Cheetah | 112 | 31.11 |
| 3. | Blue fish | 40 – 46 | 12.78 (assuming max speed) |
| 4. | Rabbit | 56 | 15.56 |
| 5. | Squirrel | 19 | 5.28 |
| 6. | Domestic mouse | 11 | 3.06 |
| 7. | Human | 40 | 11.11 |
| 8. | Giant tortoise | 0.27 | 0.075 |
| 9. | Snail | 0.05 | 0.014 |
The speed in m/s is calculated by using the conversion factor where 1 km/h is equivalent to 0.27778 m/s. The speeds in m/s are rounded to two decimal places for ease of understanding.
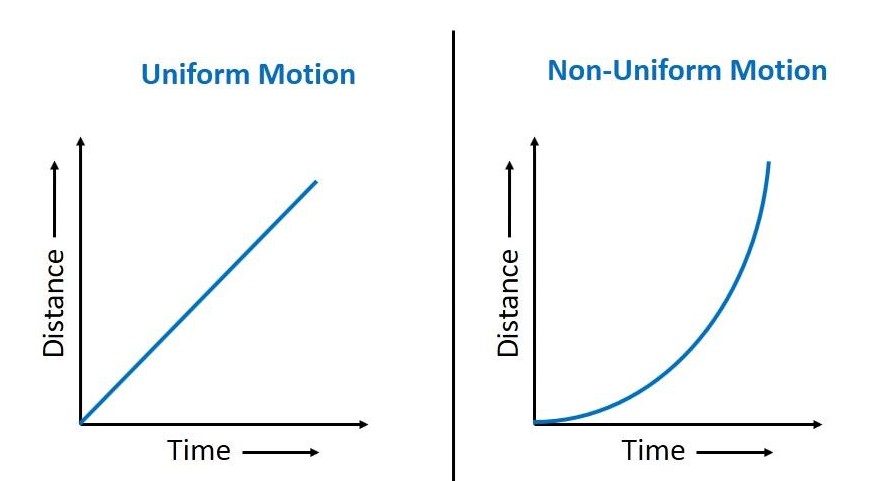
Non-uniform vs. Uniform Motion-
The concepts of non-uniform and uniform motion describe how the speed of an object can vary or remain constant over time, respectively.
Non-uniform Motion
- Non-uniform motion occurs when the speed of an object changes over time.
- This can be due to various factors such as acceleration (increasing speed), deceleration (decreasing speed), or changes in direction.
- In everyday life, most objects experience non-uniform motion. For example, a car might slow down as it approaches a traffic light and then speed up once it passes the light.
Uniform Motion
- Uniform motion is observed when an object moves at a constant speed throughout its journey.
- An object in uniform motion will cover equal distances in equal intervals of time, regardless of the length of those intervals.
- Examples of uniform motion are less common because they require conditions where forces like friction or air resistance do not cause acceleration or deceleration.
Measuring Time
Time measurement is fundamental to our understanding of motion. Throughout history, humans have developed various methods to track and measure time, from simple observations of natural events to complex mechanical devices.
Estimating Time in the Past-
Observation of Shadows-
- Before the invention of clocks, people used the length and direction of shadows to estimate the time of day.
- As the sun moves across the sky, the shadows change in length and direction, offering clues about the time.
Natural Events-
- They also observed regular natural events.
- For instance, the daily sunrise was a reliable indicator of a new day starting.
Natural Time Measurement
Day-
- Sunrise to Sunrise- A day was defined by the time from one sunrise to the next.
- This method relies on the consistent pattern of the Earth rotating on its axis, causing day and night.
Month-
- Lunar Cycle- The concept of a month was based on the lunar cycle, specifically from one new moon to the next.
- This measurement aligns with the moon’s orbit around the Earth, showing different phases.
Year-
- Earth’s Orbit- A year was determined by the time it takes for the Earth to complete a full orbit around the Sun.
- This period includes the sequence of seasons, which also helped in measuring the length of a year.
Measuring Shorter Time Intervals
- While day, month, and year measure longer time periods, there was also a need to measure shorter intervals.
- This led to the development of more sophisticated timekeeping methods, like sundials and water clocks, before modern clocks and watches.
Simple Pendulum
Structure
- Composition- A simple pendulum is made up of a heavy object called a ‘bob.’ This bob could be a metallic ball or a stone.
- Suspension- The bob is attached to a stand by a thread. The thread needs to be lightweight and strong so that it doesn’t stretch or break easily.
Rest Position
- Mean Position- When we say the pendulum is at rest, it hangs straight down from the stand. This straight-down position is known as the pendulum’s mean position. It’s the natural, balanced state of the pendulum.
Movement
- To and Fro Motion- When you pull the pendulum to one side and then let it go, it starts to move. It swings back and forth in a regular path. This type of motion is what we call ‘to and fro’ motion.
- Influence of Gravity- The movement of the pendulum is influenced by gravity. Gravity pulls the bob down, and as it moves past the mean position, momentum carries it up to the other side.
Oscillatory Motion of a Pendulum
One Oscillation
- Complete Movement- One oscillation of the pendulum is a full movement from its starting point to one side, then to the other, and back again.
- Two Paths- For instance, if you pull the pendulum to the left and release it, it swings to the right and then back to the left. That whole journey is one oscillation.
- Symmetry- The path to one side and the return journey are symmetrical, meaning they take the same time and cover the same distance.
Time Period of a Pendulum
- Duration of One Oscillation- The time period of a pendulum is the time it takes to complete one oscillation.
- Consistency- In an ideal pendulum, this time period remains consistent for each oscillation, as long as the amplitude (the maximum distance from the mean position) is small.
Historical Methods
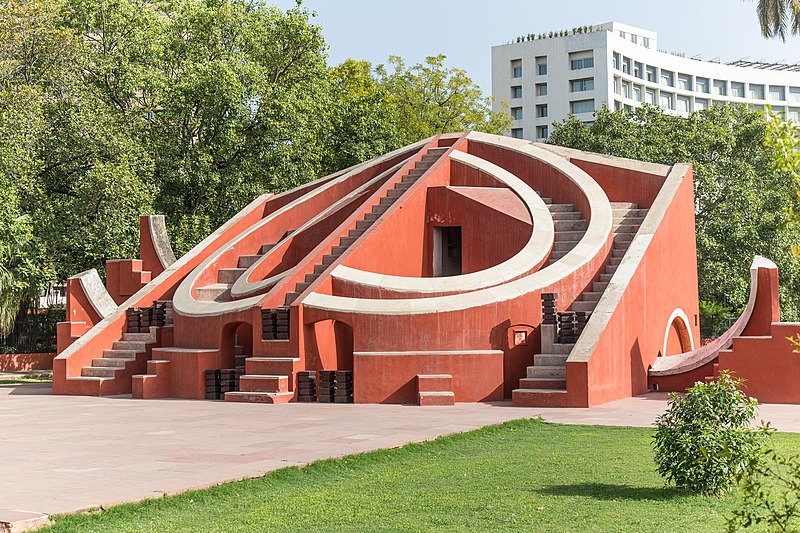
- Sundials- One of the earliest timekeeping devices, which measures time by the position of the shadow cast by a gnomon (a stick or a triangular blade) on a marked surface. As the Sun moves across the sky, the shadow aligns with different hour lines on the sundial, indicating the time of day.
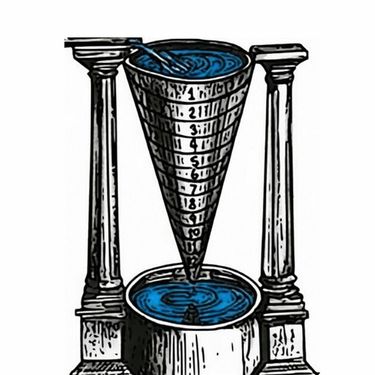
- Water Clocks- Also known as clepsydras, these devices measure time by the regulated flow of liquid from one container to another. The level of water in the second container would correspond to specific time intervals.
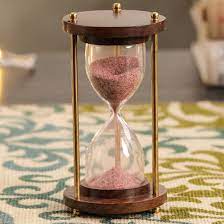
- Hourglasses- Consist of two glass bulbs connected vertically by a narrow neck that allows sand to pass from the upper bulb to the lower one. The time it takes for all the sand to pass through the neck is a fixed time interval, after which the hourglass can be inverted to start the timing again.
Modern Clocks-
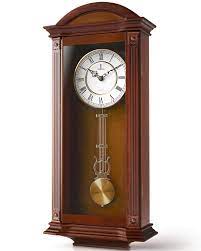
- Pendulum Clocks- Utilise the periodic motion of a swinging pendulum to keep time. The time taken for a complete swing (from one side to the other and back again) is consistent and is used to measure seconds, minutes, and hours.
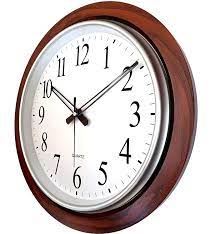
- Quartz Clocks- Use the regular vibration of a quartz crystal under an electric field to keep time. These vibrations are extremely consistent and can be used to measure time with remarkable precision.
- Atomic Clocks- The most accurate timekeeping devices available, atomic clocks measure the vibrations of atoms (usually cesium) to define the length of a second. They are so precise that they will be off by less than a second over millions of years.

Units of Time and Speed
Units of Time
- Basic Unit-
- Second- Symbolised as ‘s’. It is the fundamental unit of time.
- Larger Units-
- Minutes- Abbreviated as ‘min’.
- Hours- Abbreviated as ‘h’.
- Relation- These units are related in a standardised way- 60 seconds in a minute, 60 minutes in an hour.
Units of Speed
- Basic Unit-
- Metre per Second- Symbolised as m/s. Since speed is distance over time, m/s is the fundamental unit.
- Alternate Units-
- Metres per Minute- m/min.
- Kilometres per Hour- km/h.
Writing Units
- Singular Form- Symbols of all units are written in singular. For instance, 50 kilometres is written as ’50 km’, not ’50 kms’.
Understanding Time and Speed in Context
- Time Calculations-
- Seconds in a Day- Calculating how many seconds are in a day.
- Hours in a Year- Figuring out the number of hours in a year.
- Practical Use-
- Age- Typically expressed in years.
- Short Durations- Such as travel time, are usually not expressed in years.
Perception of Time
- One Second-
- Estimation- The time taken to say “two thousand and one” aloud is approximately one second.
- Heart Rate-
- Adults- A healthy adult’s heart beats about 72 times per minute, or about 12 times in 10 seconds.
- Children- Typically have a slightly higher rate.
Understanding Small and Large Time Intervals
Measurement of Small Time Intervals
- Common Clocks and Watches-
- Basic Limitation- The smallest time interval that standard clocks and watches can measure is one second.
- Advanced Time Measuring Devices-
- More Precise Measurements- Specialised clocks are capable of measuring time intervals much smaller than a second.
- Extremely Small Intervals- These include measurements down to a millionth (microsecond) or even a billionth (nanosecond) of a second.
- Microsecond- One microsecond equals one millionth of a second.
- Nanosecond- A nanosecond is one billionth of a second.
- Usage in Science and Technology-
- These highly precise clocks are essential in scientific research where small time measurements are crucial.
- Sports Timekeeping-
- In sports, timing devices are used that can measure time intervals to the precision of one tenth or one hundredth of a second.
Measurement of Large Time Intervals
- Historical Time-
- Centuries and Millenniums- For historical events, time is often stated in larger units like centuries (100 years) or millenniums (1000 years).
- Astronomical Time-
- Ages of Stars and Planets- In astronomy, the ages of stars and planets are frequently expressed in terms of billions of years.
Conceptualising Time Range
- The text emphasises the vast range of time intervals humans deal with, from the incredibly minute, like nanoseconds, to the immensely large, like billions of years.
Types of Graphs
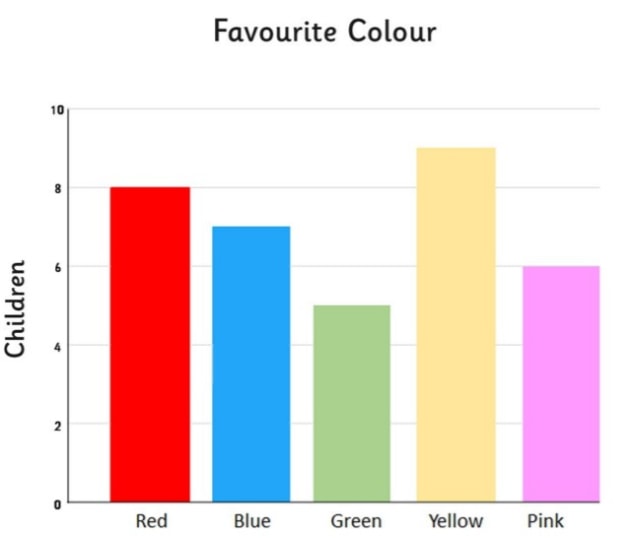
1. Bar Graph
Description:
- Rectangular Bars: In a bar graph, data is represented using bars. These bars are rectangular in shape.
- Proportional Length/Height: The length or height of each bar is significant. It shows how much or how many of something you have. The bigger the number it represents, the taller or longer the bar.
Usage:
- Easy to Understand: Bar graphs are often used in newspapers and magazines. Why? Because they make complex information simple to see and understand. You can quickly see which items are greater or lesser.
- Comparing Different Items: They are excellent for comparing different things. For example, a bar graph can show the number of students in each grade at a school.
2. Pie Chart

Description:
- Circular Graph with Sectors: Imagine a pie that is cut into different slices. Each slice (or sector) of the pie chart shows a part of the whole thing you’re measuring.
- Proportional Slices: Each slice represents a proportion or part of the total. For instance, in a pie chart showing favourite school subjects, each slice shows how popular each subject is.
Usage:
- Showing Percentages: Pie charts are great for when you want to show how a whole thing is divided. For example, it can show what portion of your day is spent on different activities like school, homework, and play.
3. Line Graph
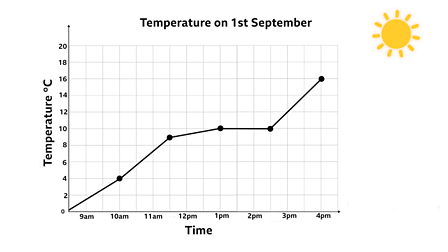
Description:
- Data Points and Lines: In a line graph, points are marked on the graph for each data value, and these points are connected with straight lines.
- Continuous Information: It’s like drawing a line that goes through all these points. This line helps us see the pattern or trend.
Usage:
- Trends Over Time: Line graphs are super useful for showing how things change over time. For example, you could use a line graph to show how your test scores have improved throughout the school year.
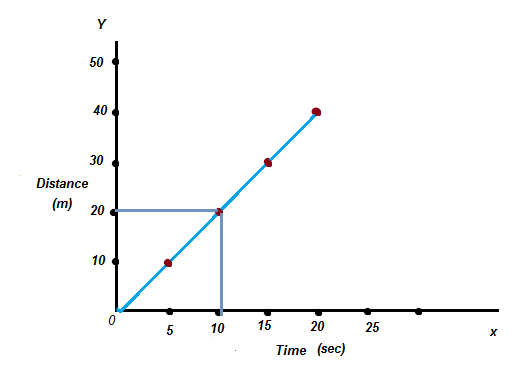
Distance-Time Graph-
A distance-time graph is a powerful tool in physics to visually represent the motion of an object over time. This type of graph displays the distance an object has travelled on the y-axis (vertical) and the time that has elapsed on the x-axis (horizontal).
Creating a Distance-Time Graph-
Starting with Axes-
- Draw two perpendicular lines on graph paper. The horizontal line is the x-axis, and the vertical line is the y-axis. The point where they intersect is called the origin (O).
Assigning Quantities-
- Decide which quantity to plot on each axis. Typically, time is along the x-axis and distance along the y-axis.
Choosing Scales-
- Select appropriate scales that will represent the distance and time on the graph. For example, you might use 1 minute = 1 cm for time and 1 km = 1 cm for distance.
Plotting Points-
- Mark points on the graph paper representing sets of values for distance and time from your data.
Drawing the Graph-
- Connect the points with a line or curve to represent the motion of the object.
Interpreting a Distance-Time Graph-
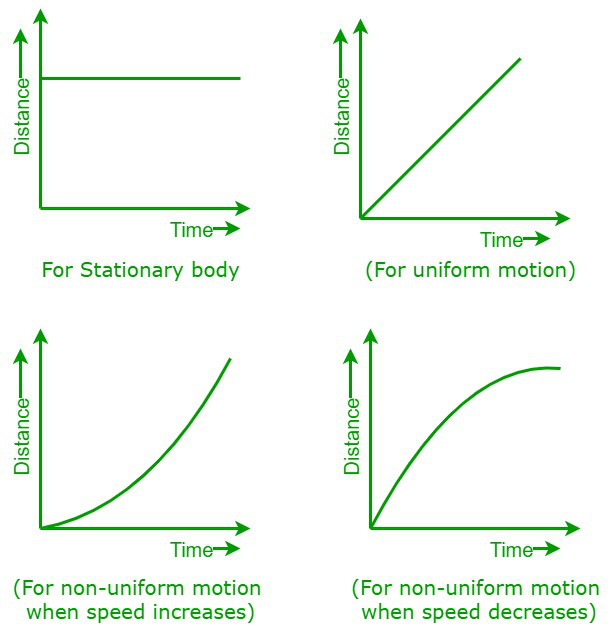
Slope of the Graph-
- The slope of the line on a distance-time graph represents the speed of the object. A steeper slope indicates a higher speed; the steeper the line, the faster the object is moving.
Horizontal Line-
- A horizontal line indicates that no distance is being covered over time. This means the object is stationary.
Straight vs. Curved Lines-
- A straight line indicates uniform motion, where the object is moving at a constant speed.
- A curved line suggests that the object is accelerating or decelerating, indicating non-uniform motion.
Practical Example-
- If you have data showing that a car moved 0 km at 0 minutes, 1 km at 1 minute, 2 km at 2 minutes, and so on, plotting these points and connecting them will result in a straight line, indicating the car is moving at a constant speed.
Analysing Motion-
- By examining the distance-time graph, you can determine the speed at any given time and observe patterns in motion, such as whether the object’s speed is increasing, decreasing, or remaining constant.
- The graph provides a visual representation that can often give more insight than a table of values, as it shows the motion over the entire period, not just at discrete times.
Practical Applications-
Understanding the theoretical aspects of motion and time is enhanced through practical applications and experiments. These activities not only reinforce the concepts but also provide real-world contexts that make learning more engaging and meaningful.
Experiments-
Timing Oscillations of a Pendulum-
- Set up a simple pendulum with a thread and a bob (a small metallic ball or stone).
- Measure the time it takes for the pendulum to complete a certain number of oscillations.
- Calculate the average time period for one oscillation by dividing the total time by the number of oscillations.
- This experiment demonstrates periodic motion and can be related to time measurement.
Measuring Speed-
- Use a speedometer to determine the instantaneous speed of a vehicle.
- Calculate the speed of objects, such as a rolling ball, by measuring the distance it travels and the time it takes, then using the speed formula (Speed = Distance / Time).
- Compare the speeds of different objects or animals listed in tables and convert units when necessary (e.g., from km/h to m/s).
Real-world Observations-
Observing Vehicles-
- Note the speed of different vehicles on a road and compare them to understand relative speeds.
- For instance, observing a bus on a trip, noting the odometer readings at intervals, and calculating the speed of the bus at different times.
- Use the odometer to measure the distance travelled and a stopwatch or clock to measure the time elapsed.
Comparing Speeds-
- Engage in activities like walking, running, or cycling, and measure the time taken to cover a known distance.
- Calculate your own speed and compare it with your peers to understand the concept of average speed and how it varies between different people or means of transport.
Graphical Representation-
- Plot distance-time graphs for different vehicles or motions to visually compare speeds and understand uniform and non-uniform motions.
- Use the graph to estimate distances covered at times not directly measured, demonstrating the utility of graphical data interpretation.
Activities and Projects-
- Encourage students to create their own time-measuring devices like sundials or simple pendulums.
- Organise projects to collect information about ancient time-measuring devices and create models of them, such as sand clocks.
- Perform activities that involve swings in a park to measure time periods and observe the effects of different masses on the period of oscillation.
Also Check – Chapter 9 – Motion and Time – 4 Worksheets Solved and Unsolved
Chapter 13 – Motion and Time–Class 7 science- Question and Answer (Fill in the Blanks)
Class 7 science -Chapter 13 – Motion and Time- Complete Notes
Chapter 13- Motion and Time–Class 7 science- Question and Answer (Solved MCQs)
Class 7 – Science- Chapter 13- Motion and Time- Question Answer (Long Question Answer)
Class 7 -Science- Chapter 13- Motion and Time Question Answer (Short Question Answer)
NCERT Solutions for Class 7 Science Chapter 13-Motion and Time
NCERT Exemplar Solutions- Class 7 Science- Chapter 13 – Motion and Time